From research to people
The same team does the science and puts it to work.
Research becomes a new model version. Partner labs have it within days. Through them it reaches healthcare providers, and through them, the people they care for.
RESEARCH
Our team, with Imperial and UCL
MODEL
New versions, validated
LABS
Within days
HEALTHCARE
Clinics and health providers
PEOPLE
From their usual blood test
Every version is validated and numbered, never silently updated, so a person's whole history stays on one scale.
The science
More signal from less data.
Health data is sparse and expensive. Our models are built to get more from a handful of common blood markers, and judged on real health outcomes. No new test, no new sample, no new workflow.
Peer reviewed
Tested against what actually happened to 306,000 people.
Built with Imperial College London and published in Communications Biology, a Nature Portfolio journal, on UK Biobank data with more than a decade of follow up.
306K PARTICIPANTS
0.778 CONCORDANCE
↑11% VS PHENOAGE
10+ yrs OF OUTCOMES
Concordance measures how well a score ranks people by what later happened to their health. 0.5 is a coin toss. 1.0 is perfect.




Imputation
A handful of markers is enough.
Most blood tests measure a fraction of what the model can read. It estimates the rest from the connections between the markers that were measured.
Compatible with 58 common analytes. A routine panel, such as a complete blood count, is one example.
Drivers of aging
One number, eight systems.
Every result breaks down into the eight biological systems behind it, so a lab can show what is adding years and what is taking them away.
EXAMPLE RESULT
Every partner lab switched the drivers on as soon as they shipped.
In development
What we are building
A large biological model, built with UCL.
With UCL, we are training a model to learn how biology actually works: cause and effect, not just correlation. Because it learns causes, it needs less data each time it is applied.
AI agents run the research loop. Each one proposes an idea, trains on it, tests it on data it has never seen and keeps what it learned, so the next idea starts sharper.
IDEAS AND LEARNINGS
- KEPT
- KEPT
- DROPPED
- KEPT
- KEPT
- DROPPED
- KEPT
- KEPT
- IDEA
- TRAIN
- TEST
- LEARN
PREDICTION ERROR Lower is better
CONNECTIONS
Sharper estimates
Better estimates of the markers a panel did not measure.
A sharper biological age
More accurate results from the same blood test.
New predictions
For partners working on everything from cancer and heart risk to women's health.
Every gain is validated before it reaches a partner lab.
Who does the science
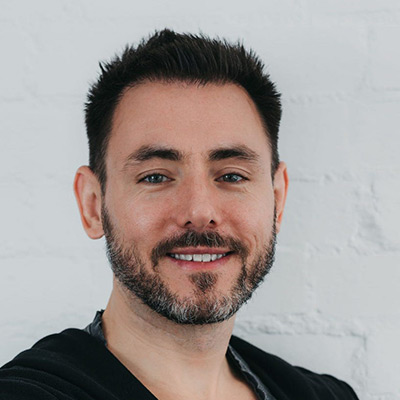
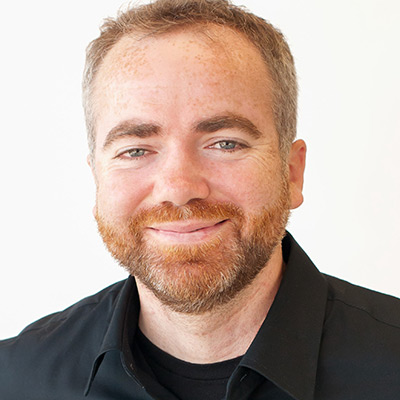
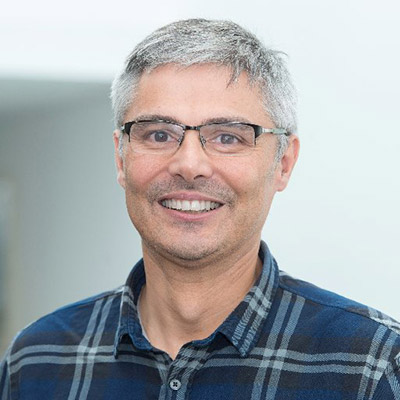
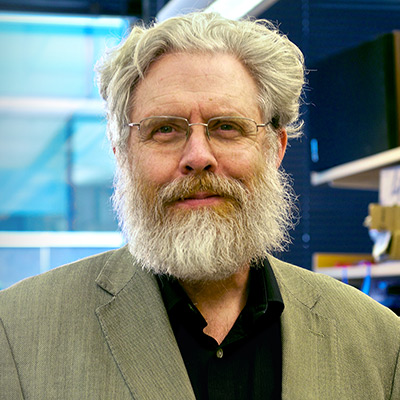
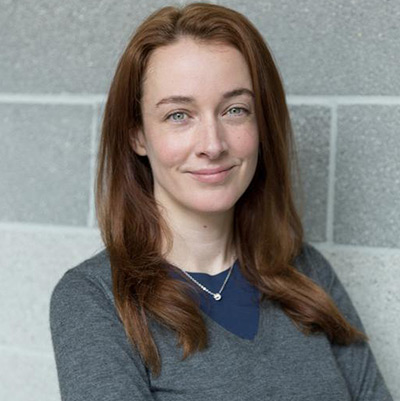
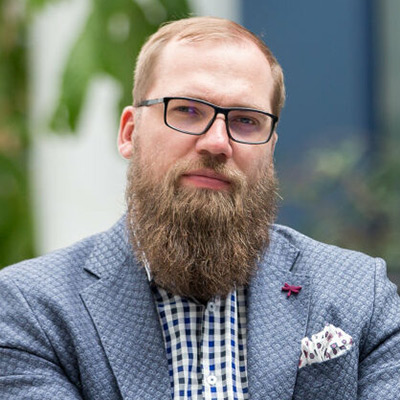
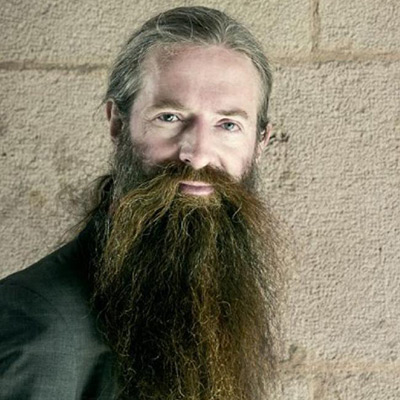
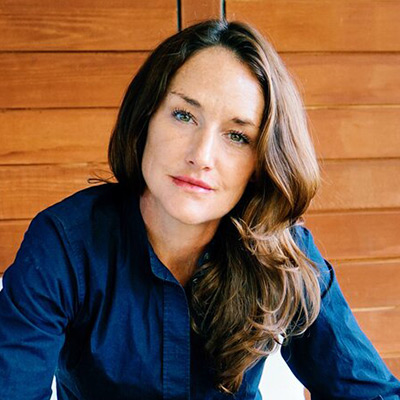
Scientists who decode aging, and operators who reached a billion people.
Data and privacy
De-identified by design.
Partner systems keep the patient. Only de-identified panel values reach us, so no patient identifying data is shared with Humanity.



Prediction is all you need.
Biological age is the proof, not the product. Read Michael Geer on where prediction goes next.